
Case study · Water network hydraulics
Irrigation pumping & HDPE network hydraulic study: Shuja Island, Abu Dhabi
Steady-state and extended-period hydraulic analysis of an irrigation pump station and HDPE distribution network for the Shuja Island development in Abu Dhabi, verifying the pump selection over the full irrigation cycle.
Client
Presidential Court
Location
Shuja Island, Abu Dhabi
Scope
Pump selection, network pressures and velocities
Tools
EPANET (extended-period simulation)
Criteria
Pumps within preferred operating range · velocity ≤ 1.5 m/s
5.1 L/s
Peak scheduled irrigation flow
1 duty + 1 standby
Pump arrangement at about 45 m head
≥ 2.8 barg
Minimum pressure at critical nodes
≤ 0.8 m/s
Maximum pipe velocity
The challenge
Varying demand over the irrigation cycle
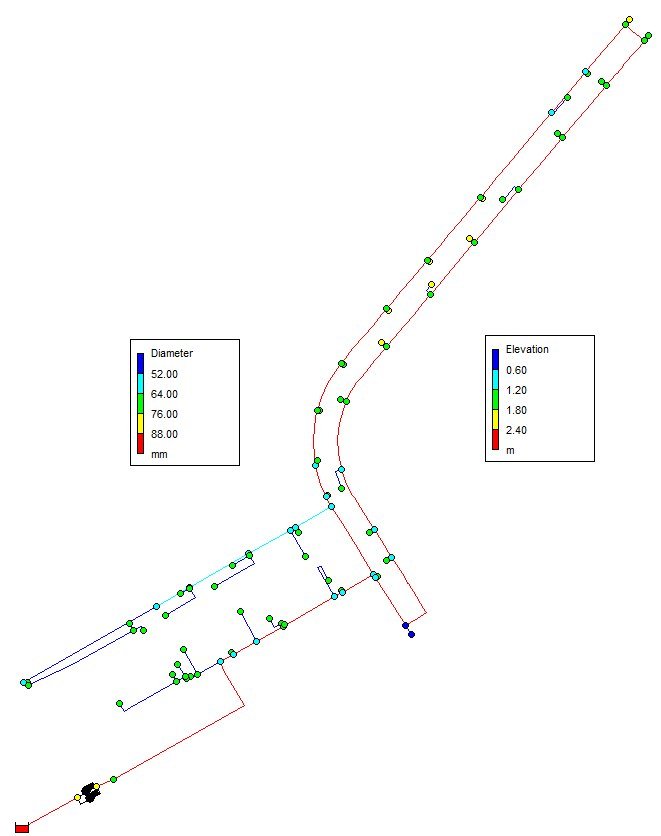
Irrigation demand changes through the day as zones open and close, so a pump selected for one duty point can drift outside its preferred range. The network also had to keep enough pressure at the most remote laterals, using HDPE pipes derated for high ambient temperatures.
Our approach
Hydraulic modelling
- Irrigation demands taken from the approved irrigation schedule
- HDPE SDR11 mainlines and laterals modelled with temperature-derated pressure ratings
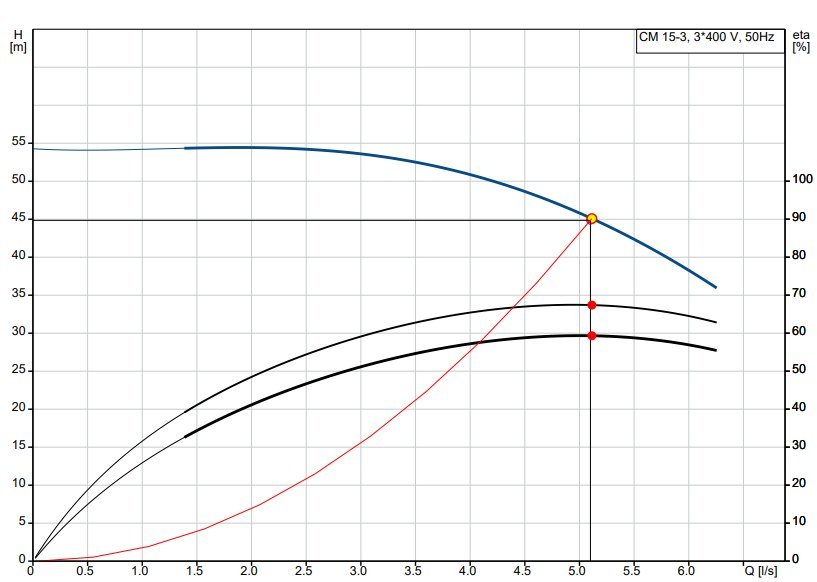
- Pump curve checked against system curves for each irrigation stage
- Extended-period simulation over the complete irrigation cycle
- Hydraulic grade line and pressure profiles along the main laterals at high and low demand
Results
Key results
Key findings
- Pump operating points range from 2.9 to 5.1 L/s at 45–54 m head, all within the recommended operating range and close to the duty point.
- Network pressures range from 2.8 to 5.4 barg, comfortably above the minimum at the critical nodes.
- Velocities range from 0.05 to 0.8 m/s, well below the 1.5 m/s limit.
- Hydraulic grade lines along the main laterals are stable at both high and low demand, confirming the pump selection and pipe sizing.
Working on a similar project?
Share your network layout, demands or water quality criteria and we will advise on the right modelling scope.