
Case study · Stormwater network design
Stormwater network design & modelling — Saadiyat, Abu Dhabi
A new stormwater network designed from the ground up for a 10.4 ha coastal development, with two lifting stations and attenuation storage. The network was modelled in InfoWorks ICM and verified against Abu Dhabi Municipality 1-in-10-year design and 1-in-25-year check storms.
Client
Modon
Location
Saadiyat, Abu Dhabi, UAE
Scope
Network layout, hydraulic modelling, pump station checks
Tools
InfoWorks ICM
Criteria
ADM drainage design manuals
10.4 ha
Total catchment area, delineated by land use
2 pump stations
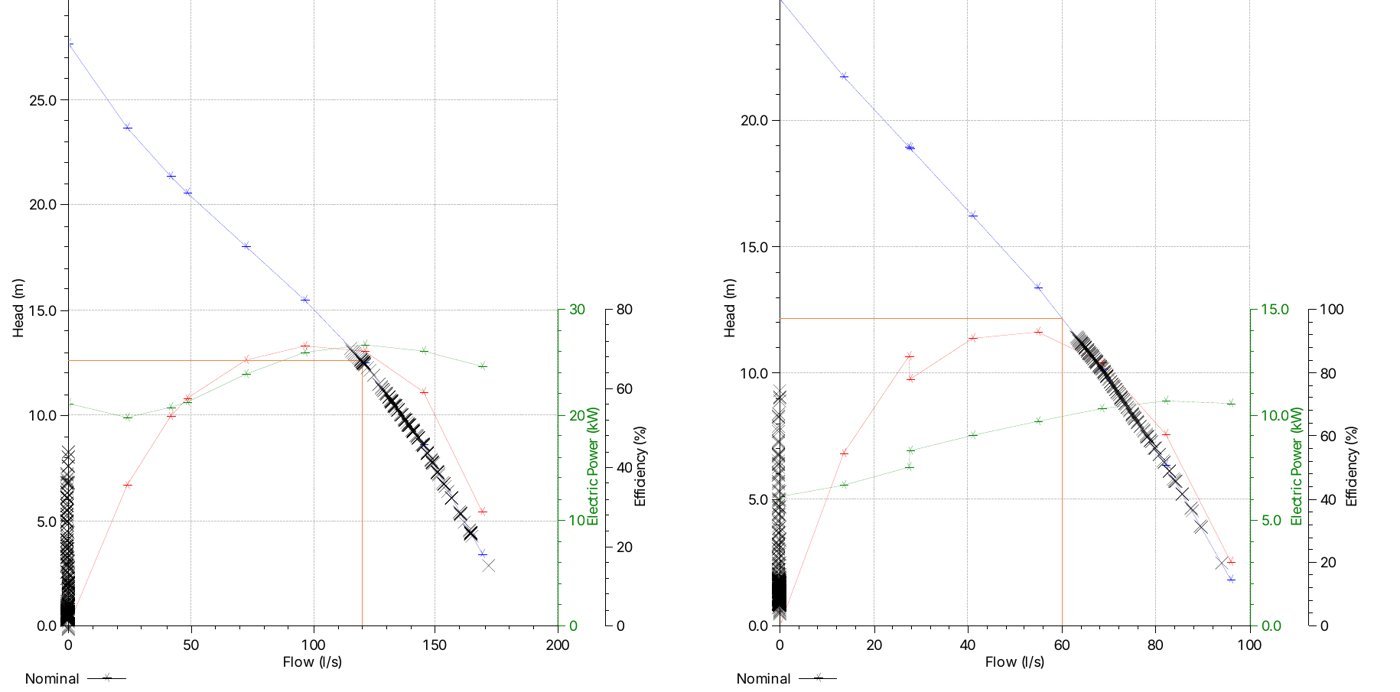
PS-01: 120 L/s · PS-02: 60 L/s at 10 m (1 duty + 1 standby)
2 × 579 m³
Underground attenuation storage cells
No flooding
Under the 1-in-10-year design storm
The challenge
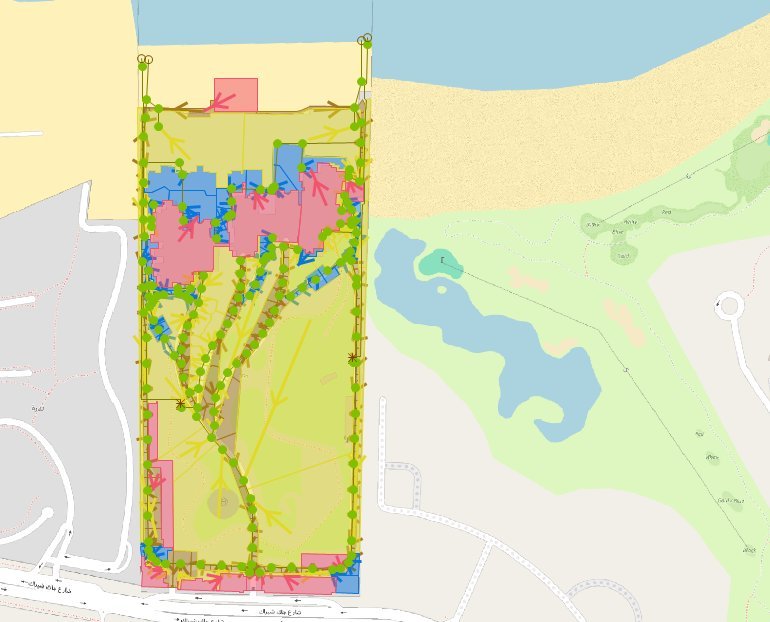
A greenfield coastal site with little natural fall
With no existing drainage to connect to, the network had to be planned from first principles. The flat coastal topography limits gravity drainage, so runoff must be collected, attenuated and lifted to the outfalls, while meeting ADM requirements for a 1-in-10-year design storm and a 1-in-25-year performance check.
Our approach
Design methodology
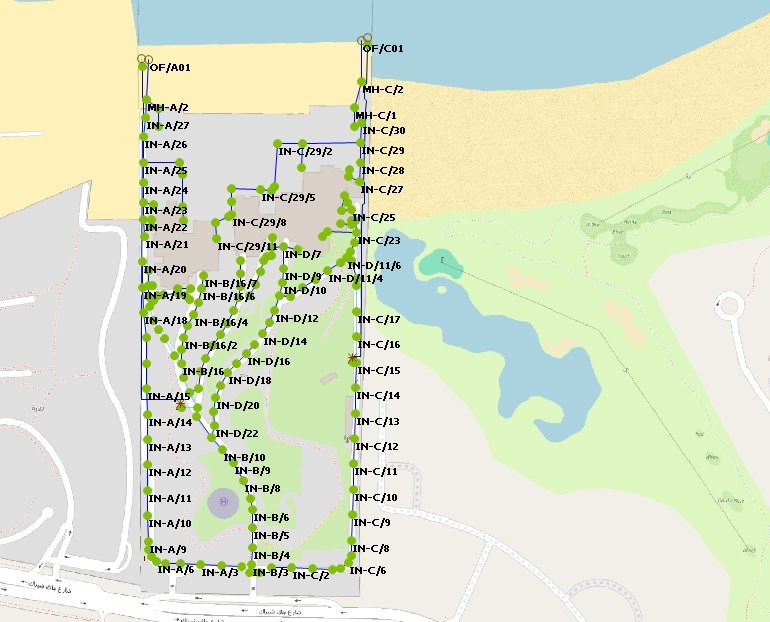
- Topographical survey review and initial network layout based on site conditions
- Catchment delineation and runoff using the Rational Method with ADM rainfall (IDF) data, runoff coefficients and time-of-concentration factors
- Pipe sizing with Manning’s equation, checked against ADM velocity and gradient limits
- Hydraulic model built in InfoWorks ICM, including pump stations, HDPE force mains and storage cells
- Performance tested under the 1-in-25-year storm, network refined for the 1-in-10-year design storm, then re-verified
- Adequacy check of the outfalls and lifting stations for both events
Results
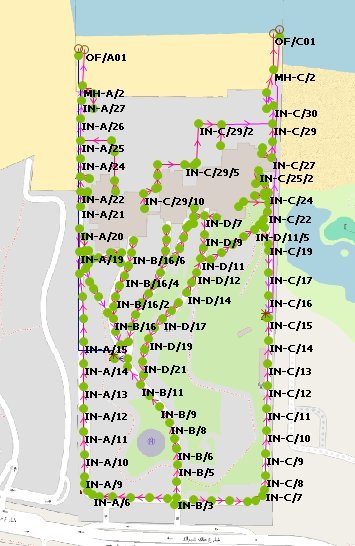
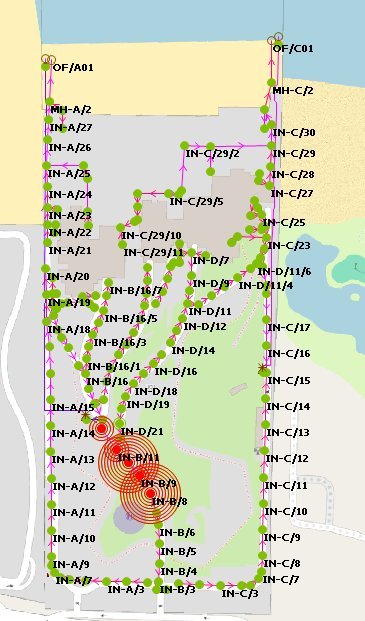
Model results
Key findings
- 10-year design: no flooding. Peak levels between IN-B10 and N-18 remain below ground.
- 25-year check: localised, contained flooding between nodes B-8 and B-12.
- Pumps operate within their allowable range in both events.
- Storage stays below capacity, and Cell 1 is not used, which leaves room for optimisation.

Deliverables
- Detailed design report with design criteria and findings
- Calibrated InfoWorks ICM model for the 10- and 25-year events
- Flood plots, long sections and pump operating points
- Pump duty selection for both lifting stations
Standards applied
- ADM Roadway Design Manual: Drainage
- ADM Stormwater & Sub-soil Drainage Systems Design Manual
- UPC Utility Corridor Design Manual
Working on a similar project?
Share your layouts, catchment data or pump station brief and we will advise on the right modelling scope.